Beginning in 1978, the late Jim Soyer made a note each General Election day of party registration for Republicans, Democrats, and Independents or others. Soyer was a longtime Governor’s Office staffer, first joining the office in 1979 and, with a few interruptions, serving in that office until his retirement in 2015. He kept up his voter registration list until 2012, when he turned it over to me.
I have continued Soyer’s practice, making note of the voter registration statistics on the day of each general election since 2014. Although voter registration closes a couple of weeks prior to the election, new voters can still be added to the rolls if they turn 18 and register for the first time prior to or on Election Day. So the Election Day statistics are the most accurate.
Here is the data:
| DEM | DEM% | GOP | GOP% | OTH | OTH% | GOP +/- | GOP +/- % | |
| 1978 | 193,345 | 45.9% | 191,766 | 45.6% | 35,707 | 8.5% | -1,579 | -0.4% |
| 1980 | 202,052 | 45.2% | 206,411 | 46.1% | 39,045 | 8.7% | 4,359 | 1.0% |
| 1982 | 189,708 | 44.5% | 200,422 | 47.0% | 36,381 | 8.5% | 10,714 | 2.5% |
| 1984 | 192,274 | 43.4% | 211,177 | 47.7% | 39,339 | 8.9% | 18,903 | 4.3% |
| 1986 | 184,720 | 43.1% | 208,935 | 48.8% | 34,442 | 8.0% | 24,215 | 5.7% |
| 1988 | 188,552 | 42.8% | 216,510 | 49.2% | 35,239 | 8.0% | 27,958 | 6.3% |
| 1990 | 180,181 | 42.9% | 207,036 | 49.3% | 33,134 | 7.9% | 26,855 | 6.4% |
| 1992 | 189,935 | 42.4% | 215,285 | 48.0% | 43,072 | 9.6% | 25,350 | 5.7% |
| 1994 | 176,991 | 41.0% | 212,544 | 49.2% | 42,448 | 9.8% | 35,553 | 8.2% |
| 1996 | 184,262 | 40.1% | 223,932 | 48.7% | 51,777 | 11.3% | 39,670 | 8.6% |
| 1998 | 179,195 | 39.6% | 219,624 | 48.5% | 54,082 | 11.9% | 40,429 | 8.9% |
| 2000 | 181,129 | 38.4% | 226,906 | 48.2% | 63,117 | 13.4% | 45,777 | 9.7% |
| 2002 | 183,343 | 38.6% | 228,200 | 48.1% | 63,171 | 13.3% | 44,857 | 9.4% |
| 2004 | 191,523 | 38.2% | 238,580 | 47.6% | 70,966 | 14.2% | 47,057 | 9.4% |
| 2006 | 190,905 | 37.6% | 240,101 | 47.3% | 76,126 | 15.0% | 49,196 | 9.7% |
| 2008 | 204,413 | 38.5% | 241,528 | 45.5% | 84,521 | 15.9% | 37,115 | 7.0% |
| 2010 | 194,204 | 37.4% | 237,809 | 45.8% | 87,348 | 16.8% | 43,605 | 8.4% |
| 2012 | 189,493 | 35.8% | 243,223 | 46.0% | 96,015 | 18.2% | 53,730 | 10.2% |
| 2014 | 176,171 | 33.8% | 240,535 | 46.2% | 104,332 | 20.0% | 64,364 | 12.4% |
| 2016 | 170,694 | 31.4% | 252,116 | 46.3% | 121,618 | 22.3% | 81,422 | 15.0% |
| 2018 | 158,972 | 29.2% | 256,502 | 47.0% | 129,834 | 23.8% | 97,530 | 17.9% |
| 2020 | 158,829 | 27.5% | 277,788 | 48.1% | 140,661 | 24.4% | 118,959 | 20.6% |
| 2022 | 151,413 | 25.4% | 296,465 | 49.7% | 149,194 | 25.0% | 145,052 | 24.3% |
| 2024 | 145,984 | 23.4% | 316,494 | 50.7% | 161,722 | 25.9% | 170,510 | 27.3% |
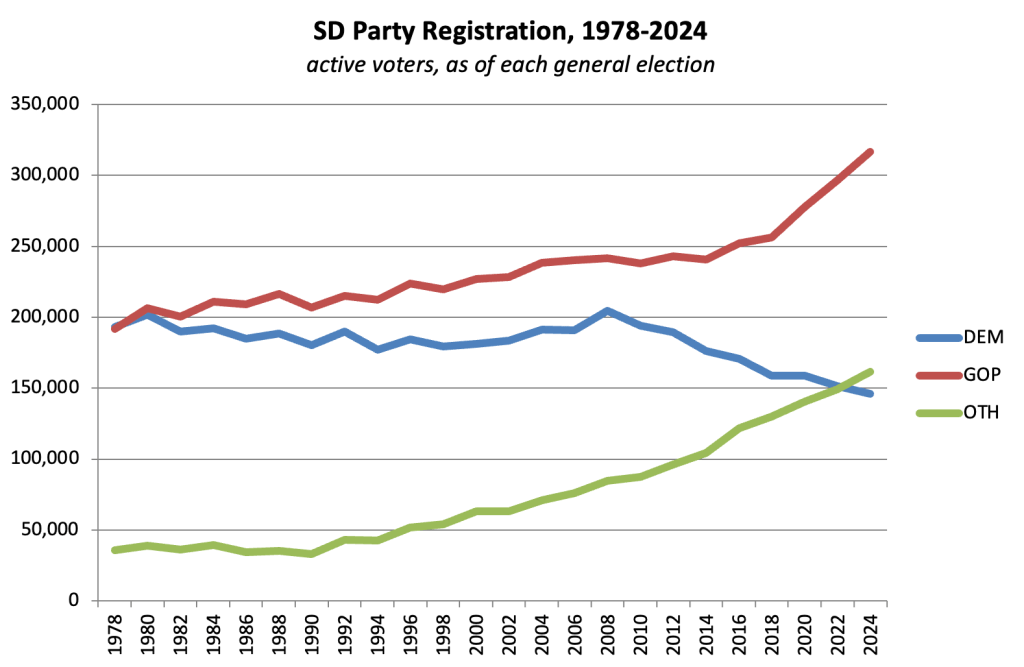
I have also created two line charts to visualize this data, one based on raw voter totals, and the other on percentages: