This is an update of a post first written prior to the 2016 general election, and last updated with the 2020 election results.
Among the other items on the ballot, South Dakota voters on Tuesday will elect the 105 state legislators who will represent them for the next two years.
With a total lack of polling in legislative races, one cannot say with certainty how the elections will turnout. In the Senate, Democrats are not contesting 22 of 35 seats, meaning that continued Republican control of the chamber is assured. In the House, Democrats failed to contest thirty-five seats, so that Republicans need only win a single contested seat to clinch continued majority control..
The past twelve years have seen Republican control of the State Legislature reach heights unseen since the 1950s. It was just over twelve years ago, in 2009-10, that the Senate had 21 Republicans and 14 Democrats, and the House had 45 Republicans and 25 Democrats. The 2010 election saw Republican numbers jump, to 30-5 in the Senate (a gain of 9 seats) and 51-19 in the House (a gain of 6 seats, counting one Republican-leaning independent). Over the past twelve years, Republicans on average have held 86.3/105 legislative seats, or 82.2%.
The most Republican legislature in state history was elected in 1952 – incredibly, Republicans controlled the Senate 35-0 and the House 73-2, for a cumulate percentage of 98.2%. The current state legislature, elected in 2020, is the most Republican since then. It has 94/105 seats controlled by Republicans (89.5%). That is the most Republicans to serve in the State Legislature since its current size of 105 (30 senators and 70 representatives) was set in 1973.
The most Democratic legislature in state history was elected in 1932, the year of the FDR landslide. Democrats controlled the Senate 29-16 and the House 70-33, holding 66.9% of the seats. (At that time, the Senate had 45 seats and the House had 103; they were reduced to 35 and 75 in 1939).
There are a few other instances where the Republicans did not hold control of the legislature:
- In 1891, the State House had 58 Republicans, 20 Democrats, and 44 Independents, who were a populist party. The Democrats and Independents joined together to organize the House.
- Likewise in 1897, a Democrat/Populist coalition controlled both houses. The Senate was 21 R, 2 D, 20 Populist; and the House was 39 R, 10 D, and 35 P.
- Democrats next took control in the aforementioned FDR landslide of 1932. They controlled both houses in 1933 and 1935. In the 1937 session, Democrats controlled the Senate and Republicans retook the House. (Note that, prior to 1963-64, the legislature only met in odd-numbered years.)
- In 1958, Democrats took the Senate 20-15 as Democrat Ralph Herseth won the governor’s office. Republicans retained control of the House, and in 1960 House Speaker Archie Gubbrud defeated Herseth for reelection.
- In 1973-4, during the Kneip Administration, Democrats controlled the legislature by the narrowest of margins: An 18-17 margin in the Senate, and a 35-35 tie in the House. Under House rules, in the case of a tie, the Governor’s party organizes the House. In 1975-6, Democrats retained control of the Senate, 19-16, but lost the House.
- Finally, in 1993-94, the Democrats won control of the Senate, 20-15, during the final two years of the Mickelson/Miller Administration.
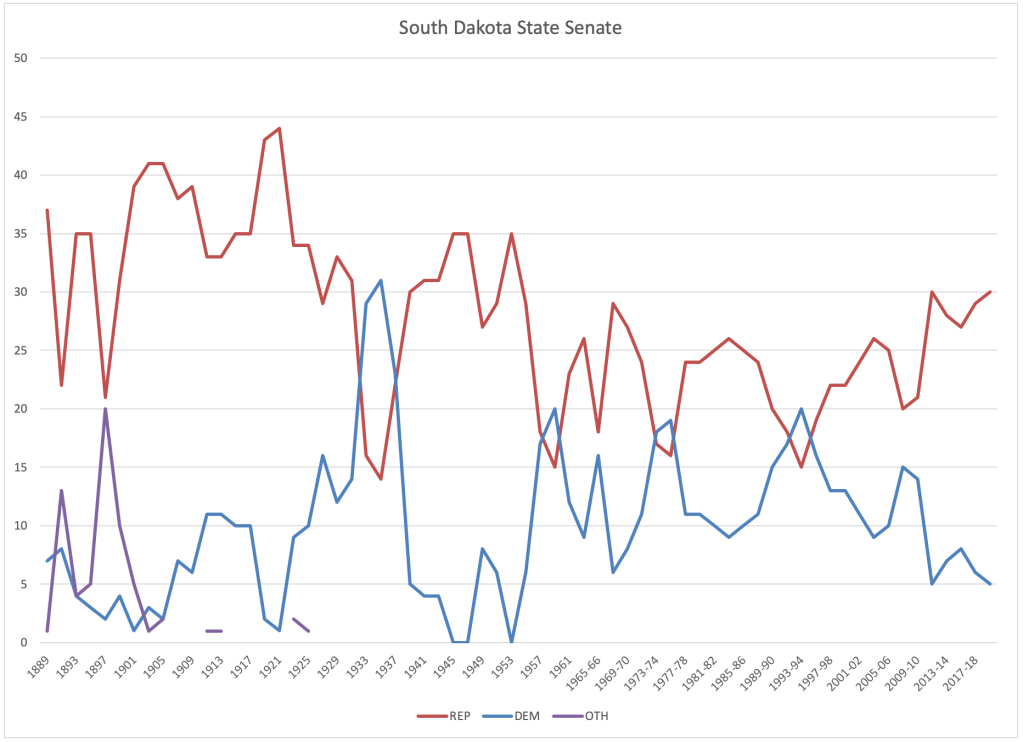
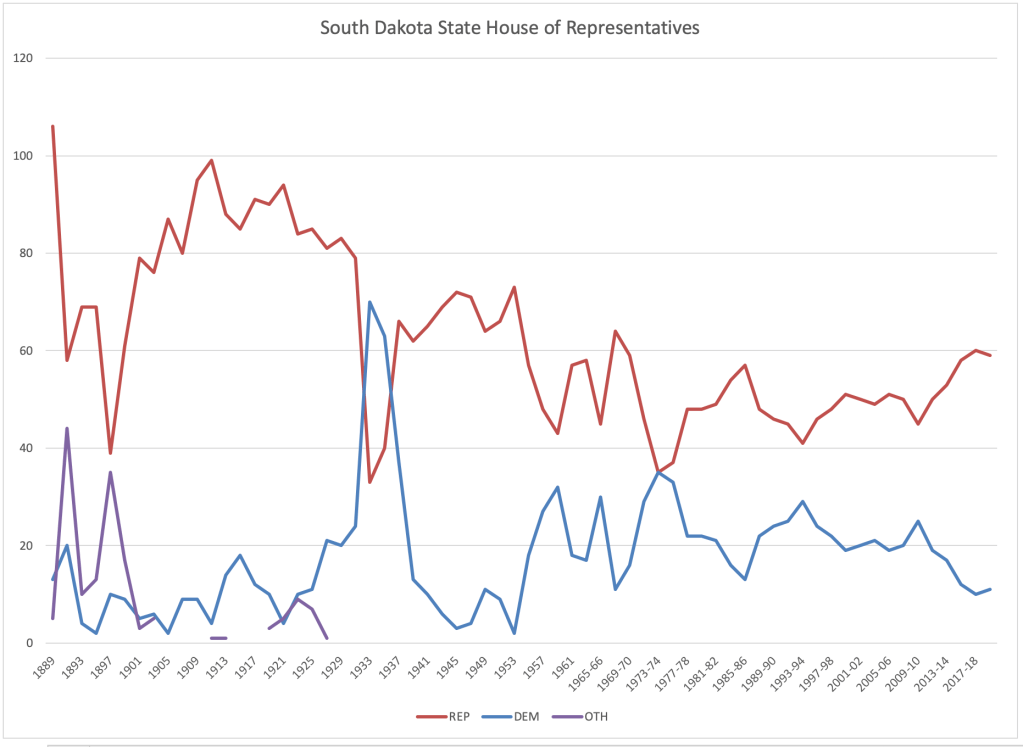
Below are two line graphs, visualizing partisan control of the Senate and House since statehood. Following those graphs is a chart of partisan control, listed by year and with the governor who was in office for each two-year legislative term.
| SESSION | GOVERNOR | SEN | HR | |||||
| YEAR | NAME | PARTY | REP | DEM | OTH | REP | DEM | OTH |
| 1889 | Mellette | REP | 37 | 7 | 1 | 106 | 13 | 5 |
| 1891 | Mellette | REP | 22 | 8 | 13 | 58 | 20 | 44 |
| 1893 | Sheldon | REP | 35 | 4 | 4 | 69 | 4 | 10 |
| 1895 | Sheldon | REP | 35 | 3 | 5 | 69 | 2 | 13 |
| 1897 | Lee | POP | 21 | 2 | 20 | 39 | 10 | 35 |
| 1899 | Lee | POP | 31 | 4 | 10 | 61 | 9 | 17 |
| 1901 | Herreid | REP | 39 | 1 | 5 | 79 | 5 | 3 |
| 1903 | Herreid | REP | 41 | 3 | 1 | 76 | 6 | 5 |
| 1905 | Elrod | REP | 41 | 2 | 2 | 87 | 2 | |
| 1907 | Crawford | REP | 38 | 7 | 80 | 9 | ||
| 1909 | Vessey | REP | 39 | 6 | 95 | 9 | ||
| 1911 | Vessey | REP | 33 | 11 | 1 | 99 | 4 | 1 |
| 1913 | Byrne | REP | 33 | 11 | 1 | 88 | 14 | 1 |
| 1915 | Byrne | REP | 35 | 10 | 85 | 18 | ||
| 1917 | Norbeck | REP | 35 | 10 | 91 | 12 | ||
| 1919 | Norbeck | REP | 43 | 2 | 90 | 10 | 3 | |
| 1921 | McMaster | REP | 44 | 1 | 94 | 4 | 5 | |
| 1923 | McMaster | REP | 34 | 9 | 2 | 84 | 10 | 9 |
| 1925 | Gunderson | REP | 34 | 10 | 1 | 85 | 11 | 7 |
| 1927 | Bulow | DEM | 29 | 16 | 81 | 21 | 1 | |
| 1929 | Bulow | DEM | 33 | 12 | 83 | 20 | ||
| 1931 | Green | REP | 31 | 14 | 79 | 24 | ||
| 1933 | Berry | DEM | 16 | 29 | 33 | 70 | ||
| 1935 | Berry | DEM | 14 | 31 | 40 | 63 | ||
| 1937 | Jensen | REP | 22 | 23 | 66 | 37 | ||
| 1939 | Bushfield | REP | 30 | 5 | 62 | 13 | ||
| 1941 | Bushfield | REP | 31 | 4 | 65 | 10 | ||
| 1943 | Sharpe | REP | 31 | 4 | 69 | 6 | ||
| 1945 | Sharpe | REP | 35 | 0 | 72 | 3 | ||
| 1947 | Mickelson | REP | 35 | 0 | 71 | 4 | ||
| 1949 | Mickelson | REP | 27 | 8 | 64 | 11 | ||
| 1951 | Anderson | REP | 29 | 6 | 66 | 9 | ||
| 1953 | Anderson | REP | 35 | 0 | 73 | 2 | ||
| 1955 | Foss | REP | 29 | 6 | 57 | 18 | ||
| 1957 | Foss | REP | 18 | 17 | 48 | 27 | ||
| 1959 | Herseth | DEM | 15 | 20 | 43 | 32 | ||
| 1961 | Gubbrud | REP | 23 | 12 | 57 | 18 | ||
| 1963-64 | Gubbrud | REP | 26 | 9 | 58 | 17 | ||
| 1965-66 | Boe | REP | 18 | 16 | 1 | 45 | 30 | |
| 1967-68 | Boe | REP | 29 | 6 | 64 | 11 | ||
| 1969-70 | Farrar | REP | 27 | 8 | 59 | 16 | ||
| 1971-72 | Kneip | DEM | 24 | 11 | 46 | 29 | ||
| 1973-74 | Kneip | DEM | 17 | 18 | 35 | 35 | ||
| 1975-76 | Kneip | DEM | 16 | 19 | 37 | 33 | ||
| 1977-78 | Kneip | DEM | 24 | 11 | 48 | 22 | ||
| 1979-80 | Janklow | REP | 24 | 11 | 48 | 22 | ||
| 1981-82 | Janklow | REP | 25 | 10 | 49 | 21 | ||
| 1983-84 | Janklow | REP | 26 | 9 | 54 | 16 | ||
| 1985-86 | Janklow | REP | 25 | 10 | 57 | 13 | ||
| 1987-88 | Mickelson | REP | 24 | 11 | 48 | 22 | ||
| 1989-90 | Mickelson | REP | 20 | 15 | 46 | 24 | ||
| 1991-92 | Mickelson | REP | 18 | 17 | 45 | 25 | ||
| 1993-94 | Mickelson/Miller | REP | 15 | 20 | 41 | 29 | ||
| 1995-96 | Janklow | REP | 19 | 16 | 46 | 24 | ||
| 1997-98 | Janklow | REP | 22 | 13 | 48 | 22 | ||
| 1999-00 | Janklow | REP | 22 | 13 | 51 | 19 | ||
| 2001-02 | Janklow | REP | 24 | 11 | 50 | 20 | ||
| 2003-04 | Rounds | REP | 26 | 9 | 49 | 21 | ||
| 2005-06 | Rounds | REP | 25 | 10 | 51 | 19 | ||
| 2007-08 | Rounds | REP | 20 | 15 | 50 | 20 | ||
| 2009-10 | Rounds | REP | 21 | 14 | 45 | 25 | ||
| 2011-12 | Daugaard | REP | 30 | 5 | 50 | 19 | 1 | |
| 2013-14 | Daugaard | REP | 28 | 7 | 53 | 17 | ||
| 2015-16 | Daugaard | REP | 27 | 8 | 58 | 12 | ||
| 2017-18 | Daugaard | REP | 29 | 6 | 60 | 10 | ||
| 2019-20 | Noem | REP | 30 | 5 | 59 | 11 | ||
| 2021-22 | Noem | REP | 32 | 3 | 62 | 8 |
The party or coalition controlling each house is designated in bold. The State Legislature began holding annual, rather than biennial, sessions in 1963.
The 1891 House of Representatives was organized by a coalition of Democrats and members of the populist “Independent Party.” In 1897, both the Senate and the House were controlled by a coalition of Democrats and Populists. In 1973-74, the State House was evenly divided at 35-35, and by rule the governor’s party, the Democrats, organized the chamber.
